Animated Experiment:

Introduction
Strain hardening is the phenomenon whereby a ductile metal becomes harder and stronger as it is plastically deformed. Sometimes it is also called work hardening or, because the temperature at which deformation takes place is “cold” relative to the absolute melting temperature of the metal, cold working. Most metals harden at room temperature. It is sometimes convenient to express the degree of plastic deformation as percent cold work (percent reduction in cross-sectional area) rather than as strain. Percent cold work (%CW) is defined as
%CW = (A_0 - A_1)/A_0*100
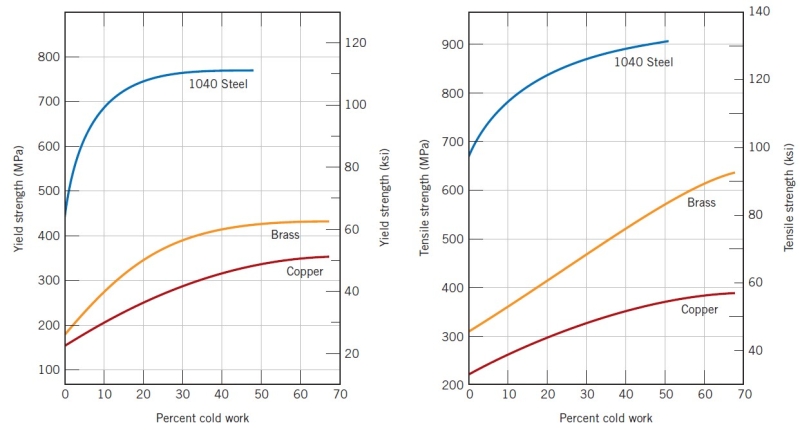
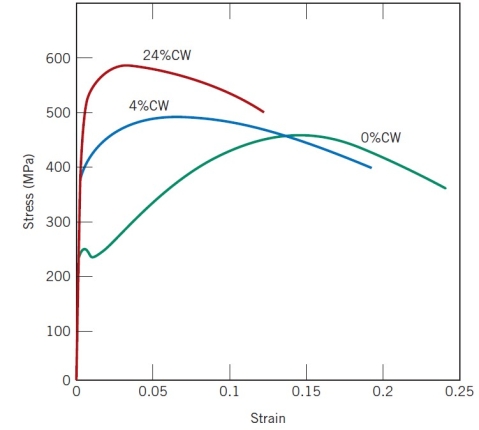
where A_0 is the original area of the cross section that experiences deformation and A_1 is the area after deformation. Strain hardening is demonstrated in a stress–strain diagram presented in the earlier tensile experiment. If the specimen is unloaded at an arbitrary point during the hardening stage, then the yield strength of the metal is raised to a value higher than its original one. The metal has thus become stronger during the process, as shown in the upper left and upper right panel of the following figure.
| 
|
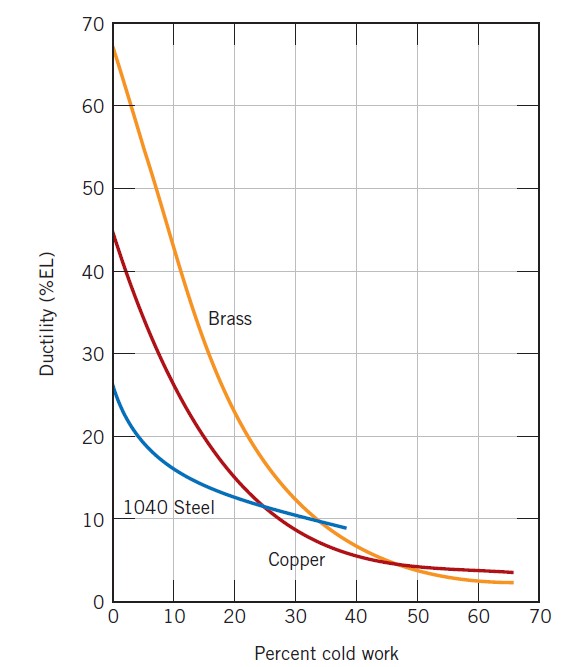
The price for this enhancement of hardness and strength is in the ductility of the metal (the lower left panel). The strain-hardening phenomenon is explained on the basis of dislocation–dislocation strain field interactions. The dislocation density in a metal increases with deformation or cold work, due to dislocation multiplication or the formation of new dislocations. Consequently, the average distance of separation between dislocations decreases, i.e. the dislocations are positioned closer together. On the average, dislocation–dislocation strain interactions are repulsive. The net result is that the motion of a dislocation is hindered by the presence of other dislocations. As the dislocation density increases, this resistance to dislocation motion by other dislocations becomes more pronounced. Thus, the imposed stress necessary to deform a metal increases with increasing cold work.
Strain hardening is often utilized commercially to enhance the mechanical properties of metals during fabrication procedures. The effects of strain hardening may be removed by an annealing heat treatment.
Principle
We recall that the stress plotted in the stress-strain diagram in the tensile test was obtained by dividing the tensile load by the cross-sectional area of the specimen measured before any deformation had taken place. Since the cross-sectional area of the specimen decreases as the tensile load increases, the stress plotted in the diagram does not represent the actual stress in the specimen. The difference between the nominal (engineering) stress that we have computed and the true stress obtained by dividing the tensile load by the cross-sectional area of the deformed specimen becomes apparent in ductile materials after yield has started. While the nominal stress, which is directly proportional to the tensile load, decreases with the tensile load during the necking phase, the true stress, which is proportional to the tensile load but also inversely proportional to the cross-sectional area, is observed to keep increasing until rupture of the specimen occurs.
Many scientists also use a definition of strain different from that of the nominal (engineering) strain, i.e. the total elongation divided by the original gauge length. Instead of using the total elongation and the original gage length, they use all the successive values of the gauge length that they have recorded. Dividing each increment of the distance between the gage marks, by the corresponding value of the instant gauge length, they obtain the elementary strain d\epsilon = dL/L. Integrating the successive values of d\epsilon, they define the true strain as follows
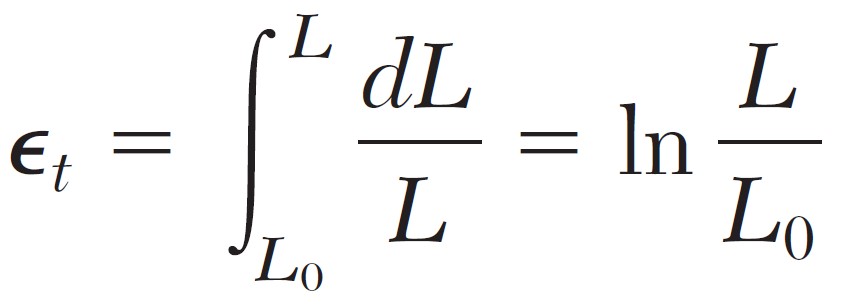
The diagram obtained by plotting true stress versus true strain, i.e. the animated diagram in the top, reflects more accurately the behavior of the material. As we have already noted, there is no decrease in true stress during the necking phase. Also, the results obtained from tensile and from compressive tests will yield essentially the same plot when true stress and true strain are used. This is not the case for large values of the strain when the nominal stress is plotted versus the nominal strain.
However, engineers, whose responsibility is to determine whether a load will produce an acceptable stress and an acceptable deformation in a given structural member, will want to use a diagram based on the nominal stress and the nominal strain, since these expressions involve data that are available to them, namely the original cross-sectional area and the gauge length of the member in its undeformed state.
A schematic comparison of nominal and true stress–strain behaviors is made in the animated diagram. It is worth noting that the true stress necessary to sustain increasing strain continues to rise past the ultimate strength D’. Coincident with the formation of a neck is the introduction of a complex stress state within the neck region (i.e., the existence of other stress components in addition to the axial stress). As a consequence, the correct stress (axial) within the neck is slightly lower than the stress computed from the applied load and neck cross-sectional area. This leads to the “corrected” curve in the animated diagram.
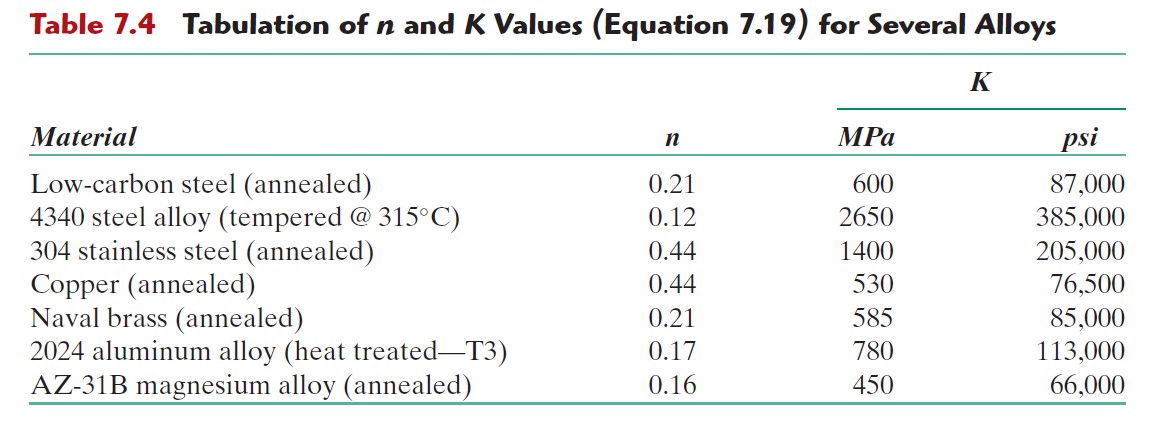
For some metals and alloys the region of the true stress–strain curve from the onset of strain hardening to the point at which necking begins may be approximated by a power law
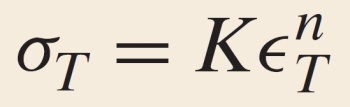
where K and n are constants; these values will vary from alloy to alloy, and will also depend on the condition of the material (i.e., whether it has been plastically deformed, heat treated, etc.). The parameter n is often termed the strain-hardening exponent (index) and has a value less than unity and greater than 0. A value of zero means that a material is a perfectly plastic solid, while a value of unity represents a 100% elastic solid. Most metals have a strain hardening exponent between 0.10 and 0.50 (Fundamentals of Materials Science and Engineering, W.D. Callister, 3rd Ed., 2008, John Wiley & Sons, pp. 209):
From the mathematical expression relating true stress and strain it is seen that the strain hardening exponent n is a measure of the ability of a metal to strain harden; the larger its magnitude, the greater the strain hardening for a given amount of plastic strain.
Objective
Determine the two constants, i.e. the strain hardening exponent n and the pre-exponent coefficient K, in the true stress – true strain formulae.
Apparatus
See tensile experiment.
Procedure
- Compared with the experimental procedure of a tensile experiment, slight modifications need to be made at the 6th step. Recall that, the construction of true stress – true strain curve needs the dimension of the specimen in deformed phase, i.e. the instant cross-sectional area and gauge length. Thus, these instant dimensions must be measured for each loading increment. To fulfill the task, enough time must be reserved after each loading increment is implemented. A pause function of the loading program is more preferable. Alternatively, a programmed loading scheme can be replaced by a manual one.
- In general, the determination of instant gauge length is relatively easier than the cross-sectional area. Since the plastic deformation becomes dominant beyond the yield strain, the volume of a testing specimen can be assumed a constant. Therefore, the instant cross-sectional area can be approximated from the volume formulae A_0*L_0 = A_1*L_1. Through such an approximation, true and nominal stress and strain can be related (Fundamentals of Materials Science and Engineering, W.D. Callister, 3rd Ed., 2008, John Wiley & Sons, pp. 208).
- After the true stress – true strain curve is determined; a power-law curve fitting procedure should be performed on its hardening portion in order to numerically determine the strain hardening exponent n and the pre-exponent coefficient K. The method of least squares is typically employed to facilitate the error analysis of the curve fitting.
Quiz
- How is the true stress defined?
- How is the true strain defined?
- Why do the elastic phase and the very beginning of the yield phase of the nominal and true stress-strain curves roughly overlap?
- In the necking phase, the nominal stress-strain curve continues decaying until the rupture of the specimen. However, the corresponding true stress-strain curve keeps rising. Explain the drastic difference.
- With reference to the nominal stress-strain curve given in the animated diagram, qualitatively compare the slope and curvature, i.e. their sign and relative magnitude, of the yield, hardening and necking phase of the true stress-strain curve.
Further Reading
- Strain Hardening Exponent (Index) http://en.wikipedia.org/wiki/Strain_hardening_exponent
- True Stress – True Strain Curve at Total Materia http://steel.keytometals.com/Articles/Art42.htm
- Fundamentals of Materials Science and Engineering, W.D. Callister, 3rd Ed., 2008, John Wiley & Sons, pp. 207, 260. (ISBN 978-0-470-12537-3)
- Mechanics of Materials, F.P. Beer, E.R. Johnston, J.T. Dewolf, and D.F. Mazurek, 6th Ed., 2012, McGraw Hill, pp.61. (ISBN: 978-0-07-338028-5)